1gida energy graphs
Message boards : Number crunching : 1gida energy graphs
| Author | Message |
|---|---|
 Greg_BE Greg_BESend message Joined: 30 May 06 Posts: 5774 Credit: 6,139,760 RAC: 0 |
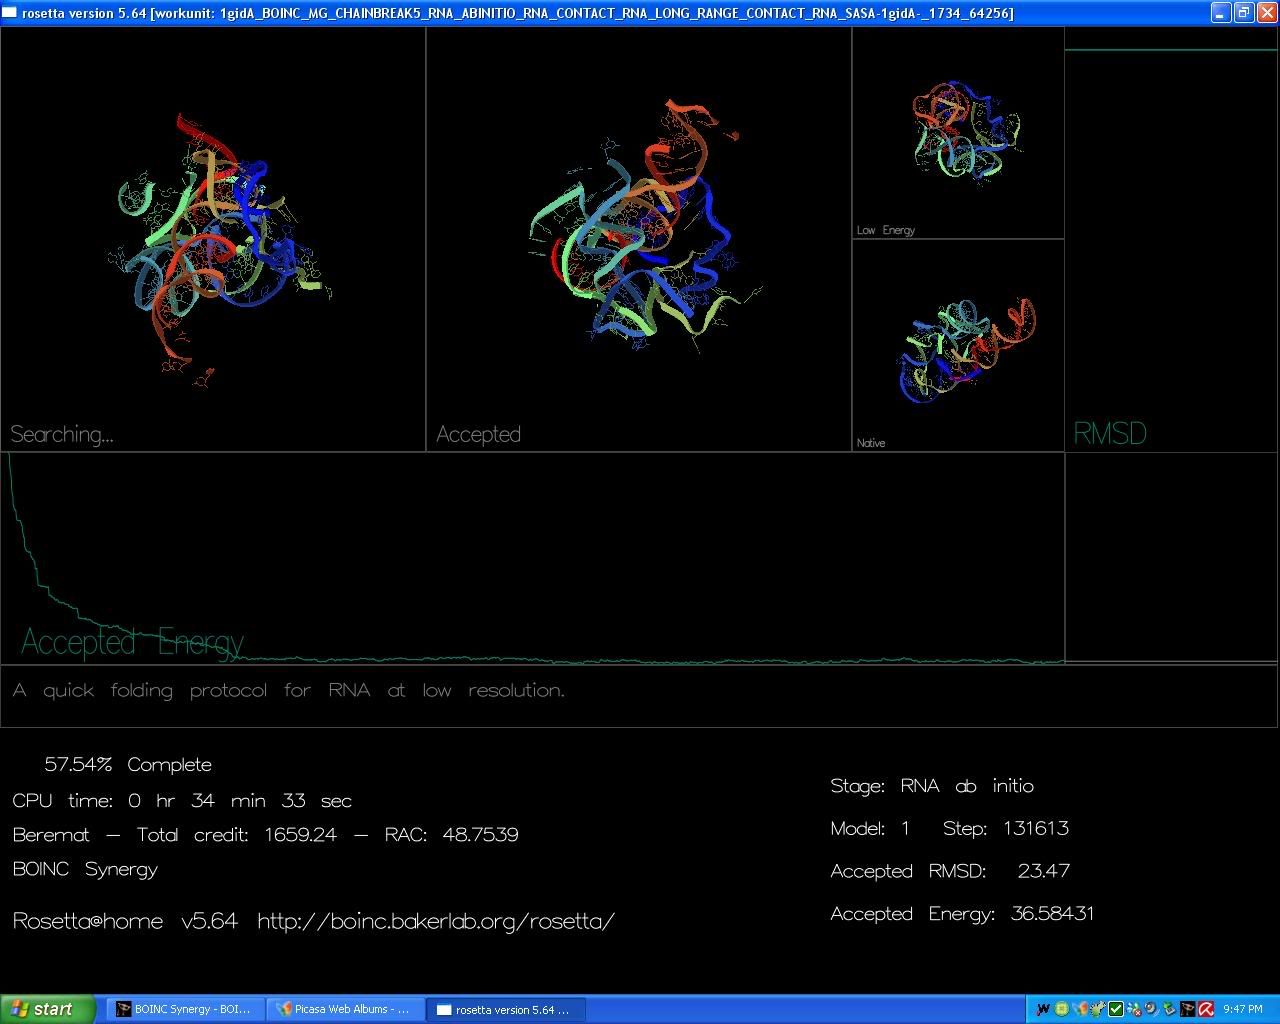
I just took a peak at the graphics window for the chainbreaks rna wu and found the bottom energy plot window divided into 3 segments and with a strange looking vertical tight lined energy plot that shifts from top down to bottom up in its plotting sequence of accepted models. this is in the rna abinito phase of things. Could someone explain this along with the strange plot in the RMSD section? (this is divided into 1 large and two small sections and has very little action to show) |
|
Greg_BE Send message Joined: 30 May 06 Posts: 5774 Credit: 6,139,760 RAC: 0 |
This is specific to the 1gidA chainbreaks and unfold RNA WU's. I've just happened to look at 2 unfold workunits when the below happens. I need to clarify this a bit more. When examining the plots of energy I see a couple of things. The accepted energy is all one window but the plot does not vary that much once it gets into the 30-40000 step area. I think the jumping I see in the energy plot as described below is due to the model increasing energy drastically when compared to where it is currently plotting. The RMSD does not seem to plot when the model gets stuck on only two different energy levels as my models seem to do. Also there is no previous model plot or whatever you call it in the bottom right corner graph window. I also seem to notice, perhaps by coincidence that if you open the graphics window on this unfold chainbreaks window that the energy plot just sticks. The model spins and twists but the energy does not vary that much. Seems stuck between two sets of values. But the graph shows there was some change before you opened the window, or so it seems. Can someone explain this weird plotting and energy sticking? I just took a peak at the graphics window for the chainbreaks rna wu and found the bottom energy plot window divided into 3 segments and with a strange looking vertical tight lined energy plot that shifts from top down to bottom up in its plotting sequence of accepted models. this is in the rna abinito phase of things. |
|
Mod.Sense Volunteer moderator Send message Joined: 22 Aug 06 Posts: 4018 Credit: 0 RAC: 0 |
I can't explain it, but I'm seeing it too if that is of any comfort. The tasks seem to complete normally. I think there are perhaps three issues involved: 1) The RNA research is still pretty new, and so they are still learning how to teach the program to get to progressively lower energy levels. And so it's jumping between two major axis swings and the corresponding energies. 2) The scale on the accepted energy chart seems to be off. I see it jump to scale up and then it seems to jump back, even though the level shown for my accepted energy isn't changing by any great degree. 3) There are two rather large proteins involved in the model and the RSMD and energy levels when two are modeled seem to be significantly different from the single protein models. See if you think these two reports on Ralph are describing the same problem. Billy's report, Feet1st's report (specifically the link to the graphic and the energy levels shown. Rosetta Moderator: Mod.Sense |
|
Greg_BE Send message Joined: 30 May 06 Posts: 5774 Credit: 6,139,760 RAC: 0 |
The screen shot is dead on. Thats what I was trying to describe. The thing about 3 hrs for one model is also correct. I have a run time of 4hrs and got only one model with 40G steps. I moved my settings to 6hrs now and have some 1gidA RNA work units coming up. I will look at those and let you know if its the same thing again. |
|
Greg_BE Send message Joined: 30 May 06 Posts: 5774 Credit: 6,139,760 RAC: 0 |
see here for my screen shots of the RNA chainbreaks graphs. Shots 1 and 2 were early on, 3 and 4 are the most recent. I am currently 1:45 into the WU out of a 6hr run time. I am seeing the same thing happening again. The majority of the time there is no action on the accepted energy graph except for when it jumps back to the higher levels for a second. The RMSD has some graphing to it but also does not move. The model energy plot is blank now except for when it goes back to higher energy levels and then it shows some dots, but due to it being a energy value for that step, it is visible for only a split second. The energy value is stuck at -467.6223 for the majority of the time, with occasional jumps to 454(5).xxxx. RMSD is stuck at 21.45 with occasional jumps to 21.46 or so. |
|
Greg_BE Send message Joined: 30 May 06 Posts: 5774 Credit: 6,139,760 RAC: 0 |
so no reply so far. I take it everyone has seen the pictures? Also I gather this is something that the group will work on for future models of RNA that focus on 1gidA? |
|
Greg_BE Send message Joined: 30 May 06 Posts: 5774 Credit: 6,139,760 RAC: 0 |
started another 1gidA WU and the graph scale is off. when the WU started the accepted energy was recorded for every move. same with RMSD and the plotting window. Now at 2hrs into the total of 6hrs and at model 1 step 39000 and counting the energy graph is stuck at the bottom and not moving and rmsd has not moved. neither has the plots. The accepted energy is jumping around from -100 to -93 as normal but no plot movement anywhere. The graphics are working fine as well. here is a screen shot. |
|
[B^S]Beremat Send message Joined: 1 Nov 06 Posts: 18 Credit: 551,409 RAC: 0 |
Strange, I don't get this behavior. THis is what my WU looks like: http://i23.photobucket.com/albums/b362/Ahriman13/ROSETTA.jpg The only thing "broken" is the RMSD graph. Are you sure it's stuck? My energy graph is moving, but I have to stare at it for about 10 seconds for it to move, since there are so many plotted points. Maybe when there are so many plotted points, it moves so slowly you can't tell? |
|
Greg_BE Send message Joined: 30 May 06 Posts: 5774 Credit: 6,139,760 RAC: 0 |
I looked a bit more closely at the graphics.(note - this is for the MG Chainbreaks WU) What I see is that the energy does not plot unless there is a change in value. If there is no change it ignores the value and does not plot it. So that may equal a stuck energy plot when compared to other work units. I see the same thing as you. No RMSD or bottom box. See here for a new shot. I have removed the others as they are not relevant any more. I just started a new 1gidA WU but this is HIGHNACL and it appears to work normally at the start. See here for a screen shot of this WU. I see the same behavior again after it gets settled into a lower energy rhythm. The plot only updates when there is a change of value. The steps can keep jumping around, but nothing will change unless the value differs. Strange, I don't get this behavior. THis is what my WU looks like: |
|
Greg_BE Send message Joined: 30 May 06 Posts: 5774 Credit: 6,139,760 RAC: 0 |
Additional note: I just saw the start of a new model after the first one got done. The initial graph goes all over until it settles on a low energy step and settles in. The accepted energy graph continues to move even though it is flat with very minute variations. There is no RMSD or plots. But later on in the refinement stage there is both RMSD and the bottom box. This seems to be in the last stages of the refinement. I looked a bit more closely at the graphics.(note - this is for the MG Chainbreaks WU) What I see is that the energy does not plot unless there is a change in value. If there is no change it ignores the value and does not plot it. So that may equal a stuck energy plot when compared to other work units. I see the same thing as you. No RMSD or bottom box. See here for a new shot. I have removed the others as they are not relevant any more. |
|
Greg_BE Send message Joined: 30 May 06 Posts: 5774 Credit: 6,139,760 RAC: 0 |
Additional note: I just saw the start of a new model after the first one got done. The initial graph goes all over until it settles on a low energy step and settles in. The accepted energy graph continues to move even though it is flat with very minute variations. There is no RMSD or plots. But later on in the refinement stage there is both RMSD and the bottom box. This seems to be in the last stages of the refinement. here is model 2 showing all the graphs. |
|
[B^S]Beremat Send message Joined: 1 Nov 06 Posts: 18 Credit: 551,409 RAC: 0 |
I think the RMSD box is broken because the RMSD is so high-over 50 at some points in the WU. So, s a result, the plots are too far to the right to be shown on the screen. They both should show as the RMSD falls below 20 or so. Even though there WUs take a long time and have some problems, I love them. The proteins have so much detail and look so awesome, especially the curved long ones. Really cool! And, the energy on mine is really low. Sometimes it goes below 850! |
|
Greg_BE Send message Joined: 30 May 06 Posts: 5774 Credit: 6,139,760 RAC: 0 |
interesting theory, maybe that value is for some other 1gidA WU's, but I am starting a new string of chainbreaks for 1gidA and the RMSD is in the 20s and not plotting. 22.41-22.43 of RMSD and there is no plot for that. I think the RMSD box is broken because the RMSD is so high-over 50 at some points in the WU. So, s a result, the plots are too far to the right to be shown on the screen. They both should show as the RMSD falls below 20 or so. |
|
Rhiju Volunteer moderator Send message Joined: 8 Jan 06 Posts: 223 Credit: 3,546 RAC: 0 |
Hi: sorry, should have posted earlier. 1gid is probably one of the biggest molecules we've run on Rosetta@home, so we didn't anticipate the scaling of the energy and rmsd axes that would make sense for the molecule. As you pointed out, the RMSD can go crazy high, and that's upsetting the automatic (and not very smart) scaling inside Rosetta. Should be fixable! Though currently our priorities are to fix the FOLD_AND_DOCK_SUBSYSTEM workunits and some similar tasks... interesting theory, maybe that value is for some other 1gidA WU's, but I am starting a new string of chainbreaks for 1gidA and the RMSD is in the 20s and not plotting. 22.41-22.43 of RMSD and there is no plot for that. |
|
Greg_BE Send message Joined: 30 May 06 Posts: 5774 Credit: 6,139,760 RAC: 0 |
thanks for the info Rhiju, that makes sense Hi: sorry, should have posted earlier. 1gid is probably one of the biggest molecules we've run on Rosetta@home, so we didn't anticipate the scaling of the energy and rmsd axes that would make sense for the molecule. As you pointed out, the RMSD can go crazy high, and that's upsetting the automatic (and not very smart) scaling inside Rosetta. Should be fixable! Though currently our priorities are to fix the FOLD_AND_DOCK_SUBSYSTEM workunits and some similar tasks... |
|
[B^S]Beremat Send message Joined: 1 Nov 06 Posts: 18 Credit: 551,409 RAC: 0 |
Thanks from me, too. Explains all of that. Anyway, seems to be over, running a BENCH_03ABRELAX WU. Models take about 6 or 7 minutes each. |
|
Greg_BE Send message Joined: 30 May 06 Posts: 5774 Credit: 6,139,760 RAC: 0 |
2 left to process and then am done with them have one that is going to take all the memory of my machine, so its waiting for memory since i interrupted it by coming to use the computer. |
Message boards :
Number crunching :
1gida energy graphs

©2026 University of Washington
https://www.bakerlab.org