credit/hour how much is possible??
Message boards : Number crunching : credit/hour how much is possible??
Previous · 1 · 2 · 3 · 4 · Next
| Author | Message |
|---|---|
zombie67 [MM] Send message Joined: 11 Feb 06 Posts: 316 Credit: 6,589,590 RAC: 317 |
Still have to say it is the best workstation going for the price. Amazing price, eh? Apple, the price leader...who'd a thunk it? And when clovertown comes out later this year, you can swap out the chips and make it an 8-way. =;^) Reno, NV Team: SETI.USA |
|
dumas777 Send message Joined: 19 Nov 05 Posts: 39 Credit: 2,762,081 RAC: 0 |
FYI. My new Mac Pro (2 dual core Intel Woodcrest 2.66 with 2 gig mem) gets about 22.84 credit per hour per core (4 total) doing rosetta under Mac OS X 10.4 (https://boinc.bakerlab.org/rosetta/workunit.php?wuid=32456733). This seems a little low and I believe it is because the rosetta app itself is poorly optimized for new Mac Pro with OS X. Was aweful harsh. Before I get the Mac fan boys hating on me, all in all, the Mac OS X is a hell of a lot better than Windows. Performance wise for scientific computing it seems comparable to Linux which means the OS has come a long way in a short amount of time. Still I have to say give me KDE or GNOME or even Motif over the MAC Gui any day of the week. |
 Hoelder1in Hoelder1inSend message Joined: 30 Sep 05 Posts: 169 Credit: 3,915,947 RAC: 0 |
Core 2 Duo E6700 @ 2.8 GHz: 23.75 c/h per core (47.5 c/h total) - got mine last weekend :-)I turned out the numbers I posted close to the beginning of this thread were somewhat on the high side (due to poor statisitics and my initial enthusiasm when I had the chip for just a couple of days ;-). I now have data from 60 eight hour WUs and the updated numbers should be accurate to about 2%: Core 2 Duo E6700 @ 2.66 GHz: 21.4 c/h per core (42.8 c/h total, 8.0 c/h per core per GHz) I now run it at stock clock speed and the OS is Linux. Oh, and I am still using DDR1 memory (ram:fsb ratio is 2/3), so this may have some negative impact. Team betterhumans.com - discuss and celebrate the future - hoelder1in.org |
|
FluffyChicken Send message Joined: 1 Nov 05 Posts: 1260 Credit: 369,635 RAC: 0 |
Has anyone but me looked at the histogram shape for their nodes ? They don't make a particularly nice shape.. Here are the summary stats though, (since 7th Sept from R@H computer results page) fluffychicken {AthlonXP 2500+ (512k), 1GB RAM)} Mean 9.563 Standard Error 0.091 Median 9.536 Mode 8.265 Standard Deviation 1.026 Sample Variance 1.053 Kurtosis 1.899 Skewness 1.232 Range 4.810 Minimum 7.747 Maximum 12.557 Sum 1214.529 Count 127 HairyMonkey {AthlonXP 3200+ (512k), 512MB RAM} Mean 11.774 Standard Error 0.253 Median 11.264 Mode #N/A Standard Deviation 2.378 Sample Variance 5.654 Kurtosis 33.482 Skewness 5.024 Range 20.431 Minimum 8.629 Maximum 29.061 Sum 1036.153 Count 88 Team mauisun.org |
|
Hoelder1in Send message Joined: 30 Sep 05 Posts: 169 Credit: 3,915,947 RAC: 0 |
Has anyone but me looked at the histogram shape for their nodes ? C2D E6700 @ 2.66 GHz c/h per core (64 eight hour WUs) -------------------------------------------------- 15 ** 16 ***** 17 ***** 18 **** 19 ****** 20 ************ 21 *** 22 ***** 23 **** 24 *********** 25 ***** 26 27 28 * 29 30 * I'd expect the histogram of completion times of individual decoys to be sort of multi-peaked (because some trajectories are terminated early when the algorithm decides that the energy isn't low enough). The credit/hour are averages over many decoys of different WU types, so the shapes of the credit/hour histograms are probably hard to predict... Team betterhumans.com - discuss and celebrate the future - hoelder1in.org |
|
R.L. Casey Send message Joined: 7 Jun 06 Posts: 91 Credit: 2,728,885 RAC: 0 |
bump |
|
Nemesis Send message Joined: 12 Mar 06 Posts: 149 Credit: 21,395 RAC: 0 |
bump So why bump 6 posts , with NO comments, and for no apparent reason other than to be obnoxious? Nemesis n. A righteous infliction of retribution manifested by an appropriate agent.  |
|
R.L. Casey Send message Joined: 7 Jun 06 Posts: 91 Credit: 2,728,885 RAC: 0 |
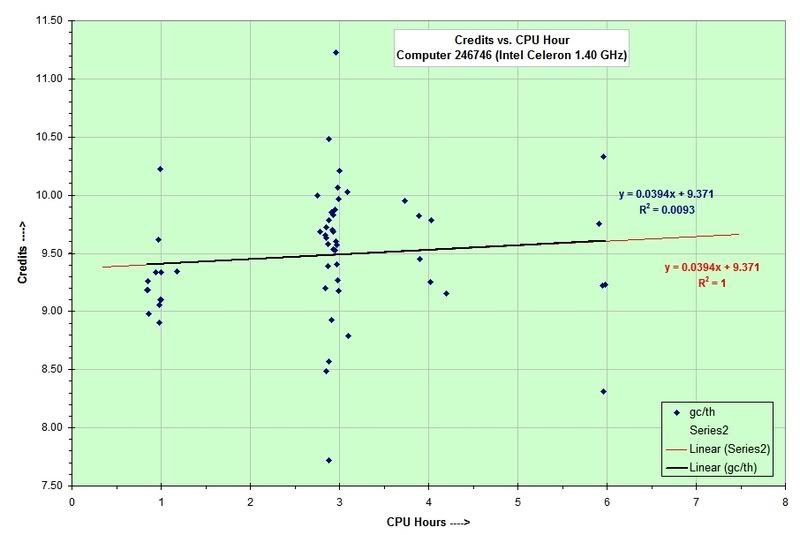
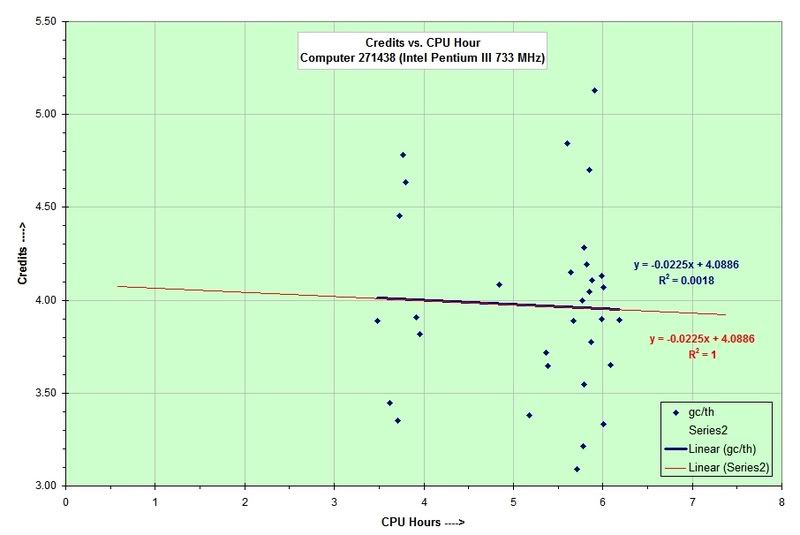
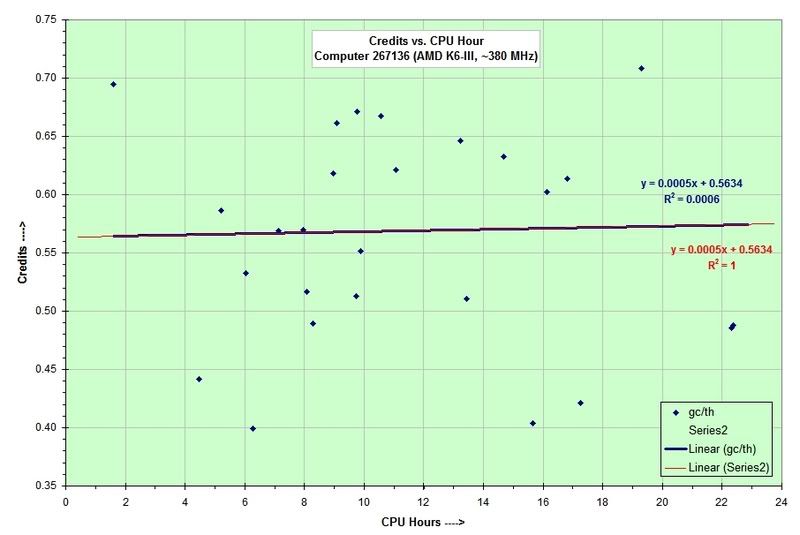
Here are some early results of (Granted) Credit vs CPU Hours for the three modestly-sized computers I now have. I have included a linear regression "fit" for each, even although the number of samples is low for good statistical significance. However, these data suggest that there may be some interesting effects--namely, that the Granted Credit per CPU Hour may *decrease* slightly with higher preferred crunching times. Since there is some overhead with starting a Work Unit, one might expect the line "fit" to slope upwards to the right. However, there may also be a slight reduction in credit as crunch times are increased a result of the "rolling average" credit calculation method. If both of these opposing effects are actual, then one would expect a slight hump in the plot, so that there might be (on average!) an "ideal" preferred crunch time that would generate the highest number of credits per CPU hour. Enough speculation for now! Time will tell... hopefully. Charts:
|
|
FluffyChicken Send message Joined: 1 Nov 05 Posts: 1260 Credit: 369,635 RAC: 0 |
Here are some early results of (Granted) Credit vs CPU Hours for the three modestly-sized computers I now have. I have included a linear regression "fit" for each, even although the number of samples is low for good statistical significance. However, these data suggest that there may be some interesting effects--namely, that the Granted Credit per CPU Hour may *decrease* slightly with higher preferred crunching times. Since there is some overhead with starting a Work Unit, one might expect the line "fit" to slope upwards to the right. However, there may also be a slight reduction in credit as crunch times are increased a result of the "rolling average" credit calculation method. If both of these opposing effects are actual, then one would expect a slight hump in the plot, so that there might be (on average!) an "ideal" preferred crunch time that would generate the highest number of credits per CPU hour. Enough speculation for now! Time will tell... hopefully. sorry but the linear fit shows absolutely nothing, If you assign the deviation to the line you could fit any direction slope you want. I would take the conclusion with a pinch of salt. Team mauisun.org |
|
R.L. Casey Send message Joined: 7 Jun 06 Posts: 91 Credit: 2,728,885 RAC: 0 |
Here are some early results of (Granted) Credit vs CPU Hours for the three modestly-sized computers I now have. I have included a linear regression "fit" for each, even although the number of samples is low for good statistical significance. However, these data suggest that there may be some interesting effects--namely, that the Granted Credit per CPU Hour may *decrease* slightly with higher preferred crunching times. Since there is some overhead with starting a Work Unit, one might expect the line "fit" to slope upwards to the right. However, there may also be a slight reduction in credit as crunch times are increased a result of the "rolling average" credit calculation method. If both of these opposing effects are actual, then one would expect a slight hump in the plot, so that there might be (on average!) an "ideal" preferred crunch time that would generate the highest number of credits per CPU hour. Enough speculation for now! Time will tell... hopefully. Did you mean to say "assign the Y-intercept"? If so, you are absolutely correct. However, I did not do that. It's a free-floating lniear regression with preliminary data. Given the clustering along the X-axis, I think that calculating independent descriptive stats for each cluster by CPU time and looking particularly at, say, the 95% confidence intervals may eventually show something one way or the other. The data eventually will speak for themselves. Any suggestions? Thanks. |
|
FluffyChicken Send message Joined: 1 Nov 05 Posts: 1260 Credit: 369,635 RAC: 0 |
Here are some early results of (Granted) Credit vs CPU Hours for the three modestly-sized computers I now have. I have included a linear regression "fit" for each, even although the number of samples is low for good statistical significance. However, these data suggest that there may be some interesting effects--namely, that the Granted Credit per CPU Hour may *decrease* slightly with higher preferred crunching times. Since there is some overhead with starting a Work Unit, one might expect the line "fit" to slope upwards to the right. However, there may also be a slight reduction in credit as crunch times are increased a result of the "rolling average" credit calculation method. If both of these opposing effects are actual, then one would expect a slight hump in the plot, so that there might be (on average!) an "ideal" preferred crunch time that would generate the highest number of credits per CPU hour. Enough speculation for now! Time will tell... hopefully. No I meant what you said next ;-) [not the y-intercept though] The scatter is very large, put 'error bars' on the average at the points you are using to calculate the best fit line (are you doing it manually or using the built in graphing function?) You'll find that the line can go up, down or flat. I'm no advanced statistitian but you'll need quite a large sample set to get anything meaningful. Another thing is you should have more data at the short runtime compared to the long run time (since you are already averaging over a larger amount of decoys for the credit value, but I don't know the extend of the effect that would have, probably more usefull for other stats). It will be nice to see how it changes over time though. The K6-III will be interesting, but not for the slop as i think it' too sow for that. But it would be interesting if it was set to default 2hrs (approx the fastest decoy you have there) and see the final time variation. Team mauisun.org |
|
R.L. Casey Send message Joined: 7 Jun 06 Posts: 91 Credit: 2,728,885 RAC: 0 |
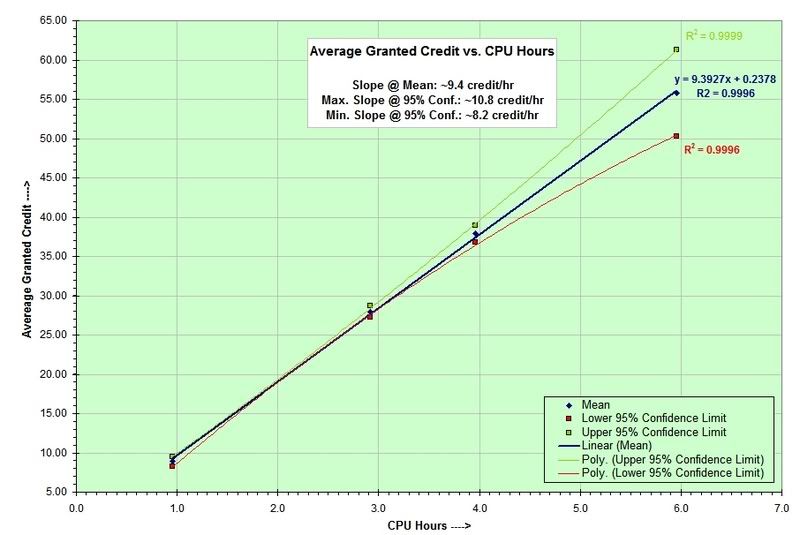
[quote]Here are some early results of (Granted) Credit vs CPU Hours for the three modestly-sized computers I now have. I have included a linear regression "fit" for each, even although the number of samples is low for good statistical significance. However, these data suggest that there may be some interesting effects--namely, that the Granted Credit per CPU Hour may *decrease* slightly with higher preferred crunching times. Since there is some overhead with starting a Work Unit, one might expect the line "fit" to slope upwards to the right. However, there may also be a slight reduction in credit as crunch times are increased a result of the "rolling average" credit calculation method. If both of these opposing effects are actual, then one would expect a slight hump in the plot, so that there might be (on average!) an "ideal" preferred crunch time that would generate the highest number of credits per CPU hour. Enough speculation for now! Time will tell... hopefully. No I meant what you said next ;-) [not the y-intercept though] Thanks for your thoughts! I again took a 'break' from installing a DIY hardwood floor and did a quick look at clustering resultls first by nominal run times, with descriptive stats, for 'Laptop', the Intel Celeron M 1.40 GHz, including a calculation of the 95% confidence limits. BTW, I am no expert in statistics either; had some in college/grad, but it was not cenvential statistis (stat. thermo) and it still makes my head throb when I deal with it. A necessary evil... The resulting graph is here. All of these results are developed with Microsoft Excel 2002, except for the best and worst case slope estimates shown in the title box; I estimated those by taking the lower confidence limit at one hour and the upper confidence limit at six hours to get the highest possible slope, with similar technique for the lowest possible slope. Slope range is approximately +/- 12%. Wouldn't want to try to navigate to the moon with that accuracy, but it's a start. It actually looks better than I would have guessed; however, an apparent inconsistency between the "Descriptive Statistics" results from the Data Analysis Tool Pack add-on and the built-in 'STEYX' function has me suspicious! There goes the throbbing head, again! :-) Another thing is you should have more data at the short runtime compared to the long run time (since you are already averaging over a larger amount of decoys for the credit value, but I don't know the extend of the effect that would have, probably more usefull for other stats). Great point about number of decoys! Yes, many more samples are needed in order to see if effects can be identified in a definitive way. I wanted to get a quick look; it's cumbersome to collect data (just ask 'mmciastro'!). It will be nice to see how it changes over time though. Which 'time'? Calendar time? The K6-III will be interesting, but not for the slop as i think it' too sow for that. But it would be interesting if it was set to default 2hrs (approx the fastest decoy you have there) and see the final time variation. The little beast is quite slow, so results come in so sl-o-o-wly. Right now I am investigating at a run time of 16 hours. I have had it as low as two hours (I need to find those archived results!), but at that time I had a lot of Work Unit timeouts because it needed to run over eight hours and was terminated by the watchdog timer before crunching the first decoy. Now that the efficiency and duration correction factor has stabilized a bit, and after I get some results at referred runtimes that I haven't used yet, I'll go back to the shorter times. It would be nice to have a set of "benchmark" WUs that could be requested occasionally--for no project credit--just to provide a "control" for some experiments. Someday, maybe. When I have emptied my home improvement 'job jar' a bit more, I hope to get some more definitive results out. Again, thanks for your thoughts. Happy and serene crunching! [edit: typo] |
|
FluffyChicken Send message Joined: 1 Nov 05 Posts: 1260 Credit: 369,635 RAC: 0 |
[quote]Here are some early results of (Granted) Credit vs CPU Hours for the three modestly-sized computers I now have. I have included a linear regression "fit" for each, even although the number of samples is low for good statistical significance. However, these data suggest that there may be some interesting effects--namely, that the Granted Credit per CPU Hour may *decrease* slightly with higher preferred crunching times. Since there is some overhead with starting a Work Unit, one might expect the line "fit" to slope upwards to the right. However, there may also be a slight reduction in credit as crunch times are increased a result of the "rolling average" credit calculation method. If both of these opposing effects are actual, then one would expect a slight hump in the plot, so that there might be (on average!) an "ideal" preferred crunch time that would generate the highest number of credits per CPU hour. Enough speculation for now! Time will tell... hopefully. 'time' I forget  I think reading it I was meaning as more results come in. It's actually not that bad (from what I found) I know with FaD tables I used to use the Get data from web part so it just grabed it automatically. Also copy and pasting doesn't take that long, less than a minute to get all my pages for a computer by copy and paste then remove the columns not needed. How do you do it ? The graphs, as always, take the longest as does making it look pretty ;-) I've got many home improvements to do here as well :-) Team mauisun.org |
|
R.L. Casey Send message Joined: 7 Jun 06 Posts: 91 Credit: 2,728,885 RAC: 0 |
FluffyChicken, thanks for your input! 'time' I forget OK, we'll see! It's actually not that bad (from what I found) I know with FaD tables I used to use the Get data from web part so it just grabed it automatically. I use cut and paste a lot, and I also have some Excel worksheets that use the Import Data from Web, and that does work well. I hadn't even noticed the 'new' function until a kind soul pointed out it's existence. (I *really* do need to explore the menus more often!) One disappointment for the Import (or my current lack of experience with it is that it is rather 'static'; I would really like to be able to follow the hyperlink to the WU Result page for each WU, and have't found a built-in way to do that yet. I think I'll just need to haul out Visual Bsic for Apps and do some code and macros to get what I want. Also, it would be a great help if there was a display options to just "Display All Results" rather than only 20 at a time. I should request that sometime! I also use the web import for an interesting (I think) small worksheet that projects Rank over time. The preliminary sheet is targeted to the "class rank" page. It uses a direct calculation version of the method Willy uses at BOINCstats.com and actual summary data for the participants. I have to record/write a macro to automate it, however, since there are a couple of steps I do manually now. IIRC, at present rates of production, I'll max out at #14 out of some 900 in the 'class' of June 7, 2006 about 11 1/2 months from now. When I get it working, I'll try to make it available to all. I haven't found the capability anywhere else yet, so there might be some interest. Also copy and pasting doesn't take that long, less than a minute to get all my pages for a computer by copy and paste then remove the columns not needed. How do you do it ? The most time in collecting has been chasing down each Result Link to get the WU name, along with manually inserting data from the result text to get run time, number of decoys & structures, and the like. Not really *that* long (hmmm, I may just be impatient...), but a little tedious. It took a few tries to tune the Import settings the way I wanted them. Also for sorting purposes, I have been changing the date & time numbers all to two-digit numbers. Definitely need to record a macro for this sometime! Any more hints? Much appreciated! The graphs, as always, take the longest as does making it look pretty ;-) [blush]Well, that *has* taken a **lot** of time.... :-) [/blush] I've got many home improvements to do here as well :-) All the best on those! Thanks again, FC! |
|
Gen_X_Accord Send message Joined: 5 Jun 06 Posts: 154 Credit: 279,018 RAC: 0 |
I slowly put my computer up to 1 day cpu time to see if it made a difference. Without typing all the numbers, my average was something like 8.34 credit/hour. Not much of a difference from what I had before. That was based on an average of 4 days. |
|
dcdc Send message Joined: 3 Nov 05 Posts: 1829 Credit: 115,508,146 RAC: 56,425 |
Anyone know how this computer manages to get so much credit per decoy (300 credits every time) when the benchmarks aren't anything out of the ordinary? I assume either they must have been pretty high when reported? Also, these results were submitted in the last few days, so how come none of the results were averaged out to more reasonable granted credit? |
|
FluffyChicken Send message Joined: 1 Nov 05 Posts: 1260 Credit: 369,635 RAC: 0 |
Anyone know how this computer manages to get so much credit per decoy (300 credits every time) when the benchmarks aren't anything out of the ordinary? I assume either they must have been pretty high when reported? Also, these results were submitted in the last few days, so how come none of the results were averaged out to more reasonable granted credit? Interesting, there are a few things worng. 1) The clained credit is pretty much 1 credit per second 2) They are state 'invalid' so have the devs implemented crediting the claimed amount on invalid work ? and a max a 300 is kicking in. Anyone want to test ? Team mauisun.org |
|
Mod.Tymbrimi Volunteer moderator Send message Joined: 22 Aug 06 Posts: 148 Credit: 153 RAC: 0 |
|
|
Gen_X_Accord Send message Joined: 5 Jun 06 Posts: 154 Credit: 279,018 RAC: 0 |
Anyone know how this computer manages to get so much credit per decoy (300 credits every time) when the benchmarks aren't anything out of the ordinary? I assume either they must have been pretty high when reported? Also, these results were submitted in the last few days, so how come none of the results were averaged out to more reasonable granted credit? That's like 100 credit/hour, and granted credit at that, look at what the claimed credit is? I'd say this user is using a very special optimized boinc client, and probably one they made themselves. Not even the dual processors are coming close to that kind of credit/hour. Much less that kind of RAC....sheesh. |
|
Jose Send message Joined: 28 Mar 06 Posts: 820 Credit: 48,297 RAC: 0 |
Anyone know how this computer manages to get so much credit per decoy (300 credits every time) when the benchmarks aren't anything out of the ordinary? I assume either they must have been pretty high when reported? Also, these results were submitted in the last few days, so how come none of the results were averaged out to more reasonable granted credit? Checking those types of credits used to be my job. My suggestion: when you find a suspicious claim use the email Addy provided for the moderators, report it and please provide data to back up your claims. Ask that that data be forwarded to David Kim. This and no other is the root from which a Tyrant springs; when he first appears he is a protector.†Plato |
Message boards :
Number crunching :
credit/hour how much is possible??

©2024 University of Washington
https://www.bakerlab.org